Chart Editor Help
Step-by-step setup for template charts and custom ECharts mode.
Choose A Mode
Use Builder mode for guided filters and SQL generation. Use Raw SQL when you need full query control.
Validate Quickly
Use Compile, Dry Run, and Preview before saving to confirm SQL, columns, and chart shape.
Save Reusable Charts
After save, use Edit and Clone to iterate quickly from a working chart definition.
- Select a chart template in Visual Builder.
- Choose Builder or Raw SQL mode.
- If Raw SQL is selected, paste query and click Compile.
- Click Dry Run to inspect columns and sample rows.
- Use Preview to confirm final rendering.
- Click Add Chart.
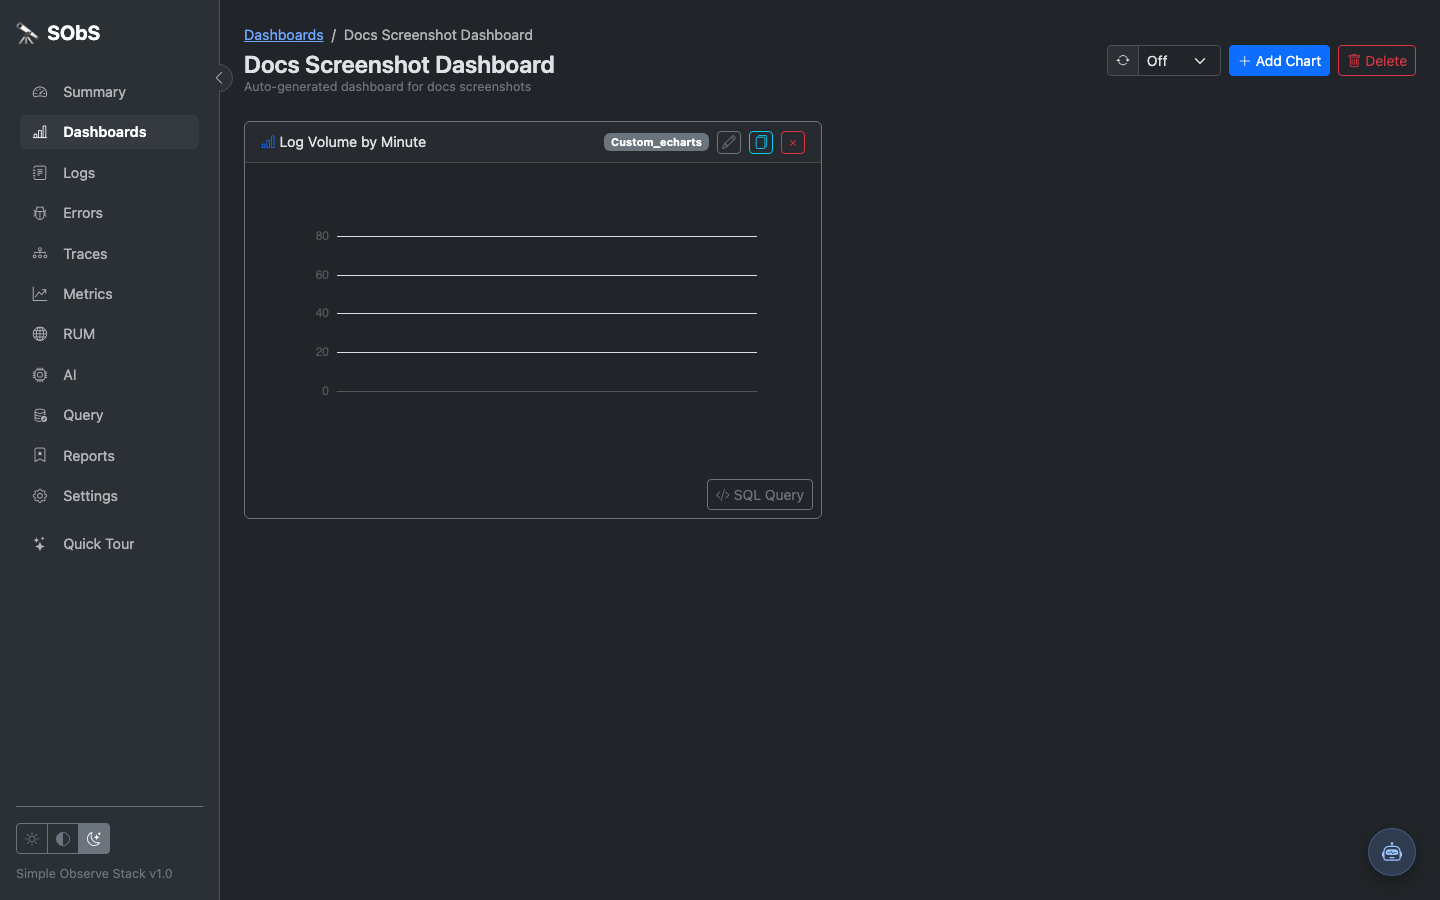
For Custom ECharts, three inputs are authoritative: Raw SQL, Custom Mapping JSON, and Custom Option JSON.
ORDER BY ts, service).
Placeholders in option JSON can use mapped keys (example: {{points}}) and built-ins ({{rows}}, {{records}}, {{columns}}).
Raw SQL
SELECT
  toStartOfMinute(Timestamp) AS ts,
  quantile(0.95)(Duration) AS p95_ms
FROM otel_traces
WHERE Timestamp >= now() - INTERVAL 2 HOUR
GROUP BY ts
ORDER BY ts
LIMIT 240
Mapping JSON
{
  "points": { "from": "rows" },
  "_drilldown": {
    "target": "traces",
    "label": "Open source traces",
    "extra": { "service": "{{service}}" }
  }
}
Option JSON
{
  "xAxis": { "type": "time" },
  "yAxis": { "type": "value" },
  "series": [
    { "type": "line", "data": "{{points}}", "smooth": true }
  ]
}
examples/custom_echarts. Ensure every custom SQL query has explicit ORDER BY for deterministic chart output.